perf 是常用的性能分析工具,记录基本使用方法。
1. 概述
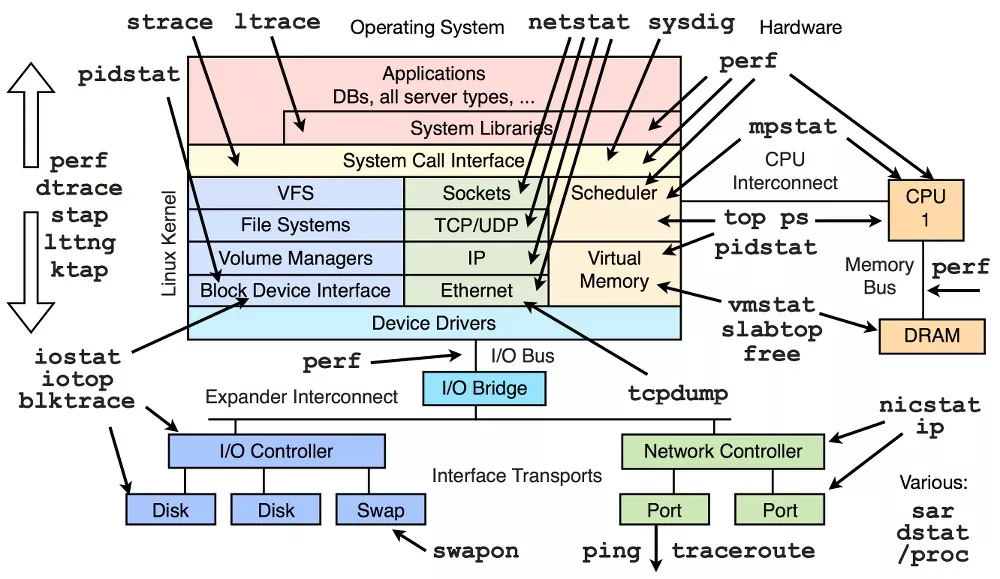
通过命令工具图片,查看 perf 都使用在哪个环节,perf 的使用说明可以参考 wiki,或者 perf -h 帮助。

图片来源:Linux Performance。
2. 应用
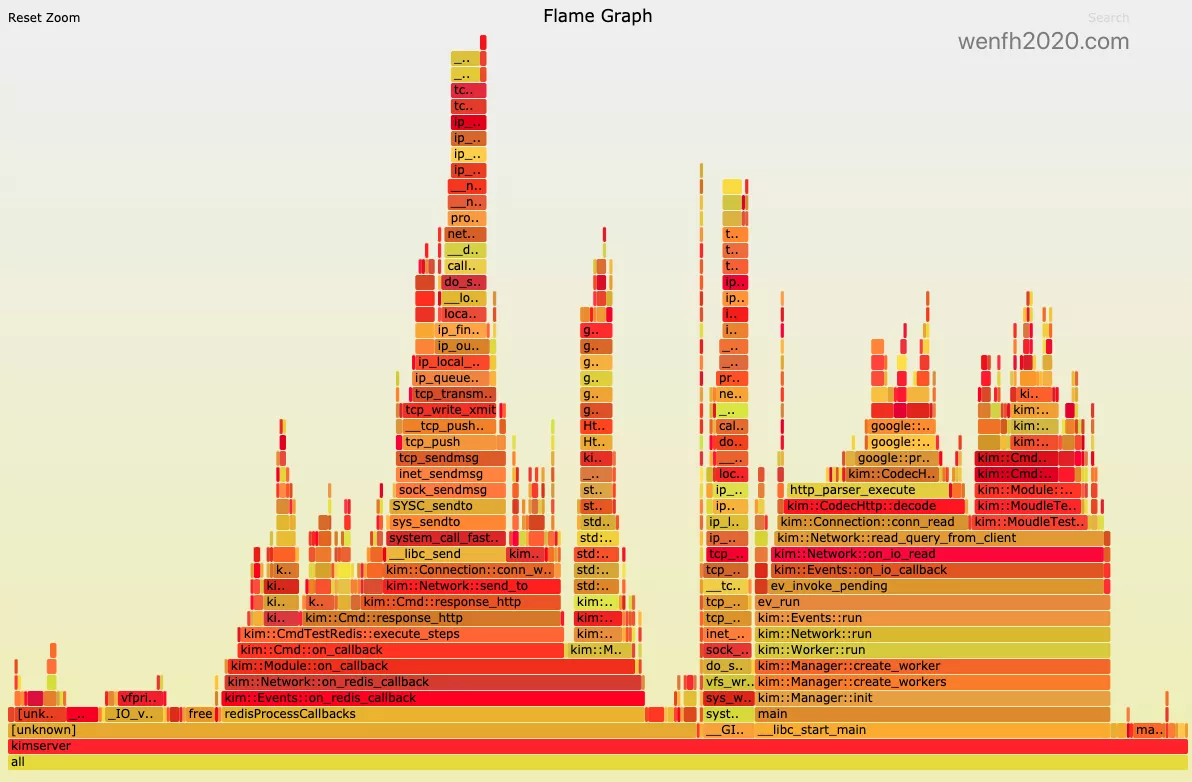
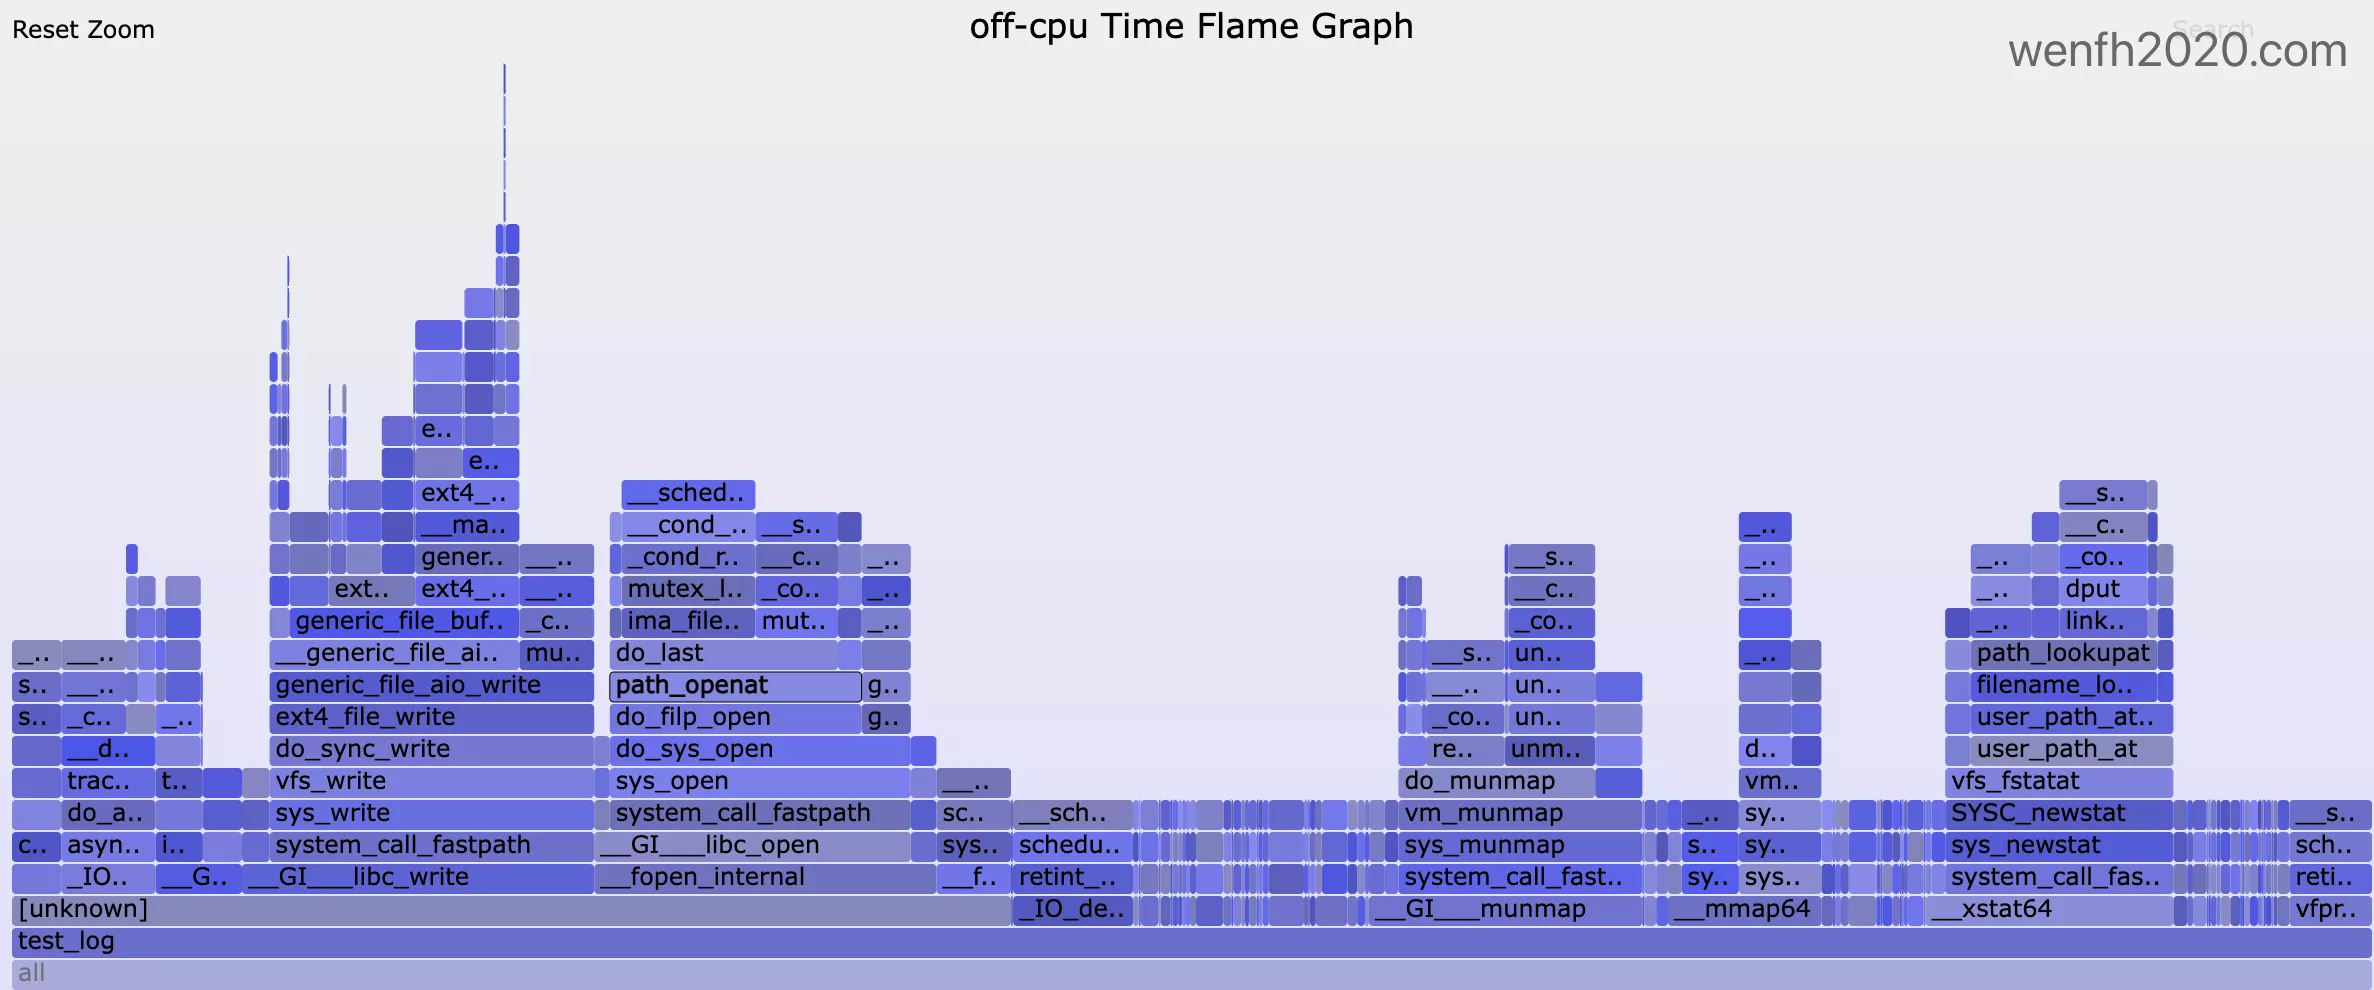
比较经典的应用,就是 perf 采集的数据可视化——火焰图(on-cpu / off-cpu)。
详情参考:软件性能检测–火焰图 🔥
- on-cpu。

- off-cpu。

3. 常用命令
1
2
3
4
5
6
7
8
9
10
11
12
13
14
15
16
17
18
19
20
21
22
23
24
25
26
27
28
29
30
31
32
33
34
# perf -h

 usage: perf [--version] [--help] [OPTIONS] COMMAND [ARGS]

 The most commonly used perf commands are:
   annotate        Read perf.data (created by perf record) and display annotated code
   archive         Create archive with object files with build-ids found in perf.data file
   bench           General framework for benchmark suites
   buildid-cache   Manage build-id cache.
   buildid-list    List the buildids in a perf.data file
   c2c             Shared Data C2C/HITM Analyzer.
   config          Get and set variables in a configuration file.
   data            Data file related processing
   diff            Read perf.data files and display the differential profile
   evlist          List the event names in a perf.data file
   ftrace          simple wrapper for kernel's ftrace functionality
   inject          Filter to augment the events stream with additional information
   kallsyms        Searches running kernel for symbols
   kmem            Tool to trace/measure kernel memory properties
   kvm             Tool to trace/measure kvm guest os
   list            List all symbolic event types
   lock            Analyze lock events
   mem             Profile memory accesses
   record          Run a command and record its profile into perf.data
   report          Read perf.data (created by perf record) and display the profile
   sched           Tool to trace/measure scheduler properties (latencies)
   script          Read perf.data (created by perf record) and display trace output
   stat            Run a command and gather performance counter statistics
   test            Runs sanity tests.
   timechart       Tool to visualize total system behavior during a workload
   top             System profiling tool.
   version         display the version of perf binary
   probe           Define new dynamic tracepoints
   trace           strace inspired tool
3.1. top
1
2
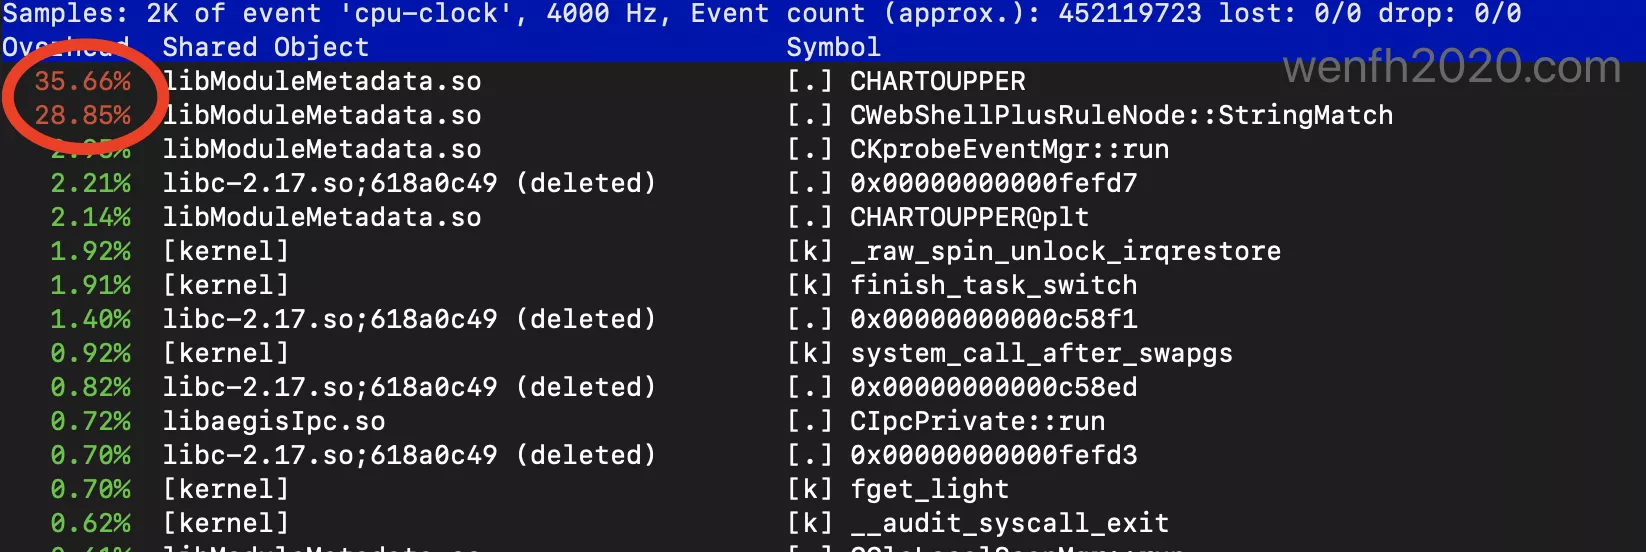
# perf top -h
perf top -p <pid>

3.2. 待续
…

