火焰图是一种基于 SVG 格式的矢量图,由 Linux perf 性能分析工具采集的采样数据生成。它通过将软件在系统中的运行行为采样数据转化为图形化展示,为性能分析提供直观的可视化结果。
1. 概述
1.1. perf
perf 是 Linux 系统内置的性能分析工具,可用于对指定进程进行采样。结合采样脚本(如 fg.sh),可采集目标进程的运行数据并生成火焰图 perf.svg。
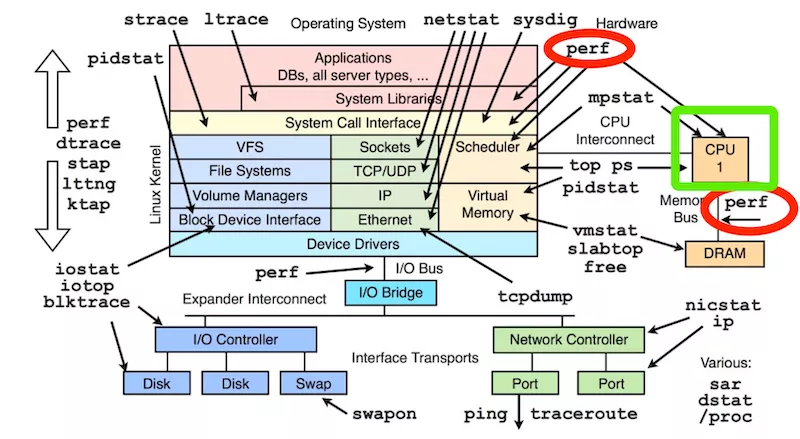
图片来源:Linux Performance。
1.2. 火焰图
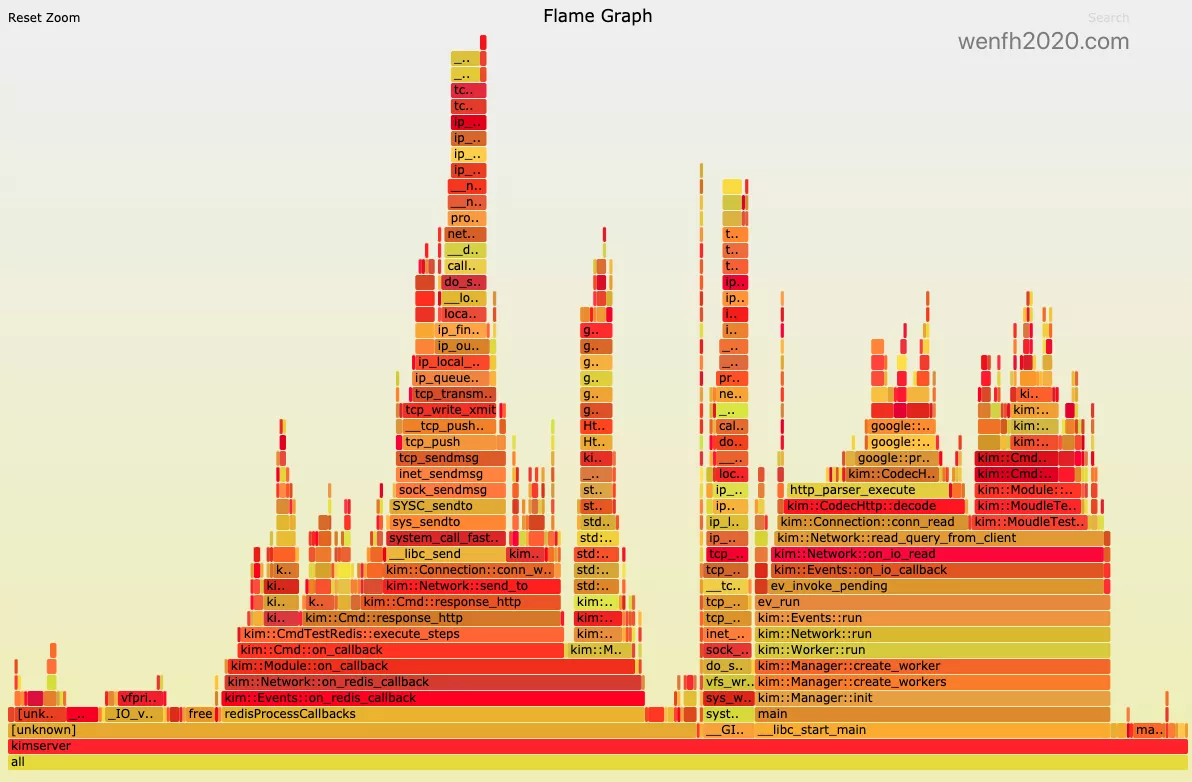
基于 perf 采样数据生成的二维火焰图,其坐标轴含义如下:
- Y 轴表示调用栈深度:从下至上展示函数的嵌套调用关系,每一层代表一个函数帧。
- X 轴表示资源消耗分布:每个函数块的宽度与其在采样中出现的次数成正比。宽度越大,表示该函数占用的 CPU 时间越多,越可能是性能瓶颈所在。
通过火焰图,开发者可以快速识别系统中的性能热点,并针对性地优化关键代码路径。
2. 安装 perf 和 FlameGraph
1
2
3
4
5
6
7
8
# centos
yum install perf
# ubuntu
# apt-get install linux-tools-$(uname -r) linux-tools-generic -y
cd /usr/local/src
git clone https://github.com/brendangregg/FlameGraph.git
ln -s /usr/local/src/FlameGraph/flamegraph.pl /usr/local/bin/flamegraph.pl
ln -s /usr/local/src/FlameGraph/stackcollapse-perf.pl /usr/local/bin/stackcollapse-perf.pl
3. On-CPU 火焰图
On-CPU 火焰图用于分析进程或线程在 CPU 上执行时的性能特征。
3.1. 脚本
以下脚本可用于抓取指定进程的 CPU 采样数据并生成火焰图:
【注意】该脚本无法采集处于睡眠状态或未处于运行状态的进程/线程数据。
- fg.sh 。
1
2
3
4
5
6
7
8
9
10
11
12
13
#!/bin/sh

work_path=$(dirname $0)
cd $work_path

if [ $# -lt 1 ]; then
    echo 'pls input pid!'
    exit 1
fi

[ -f perf_with_stack.data ] && rm -f perf_with_stack.data
perf record -g -o perf_with_stack.data -p $1 -- sleep 20
perf script -i perf_with_stack.data | stackcollapse-perf.pl | flamegraph.pl > perf.svg
- 命令。
1
./fg.sh <pid>
- 操作视频。
3.2. 定位问题
3.2.1. 案例一:日志函数调用优化
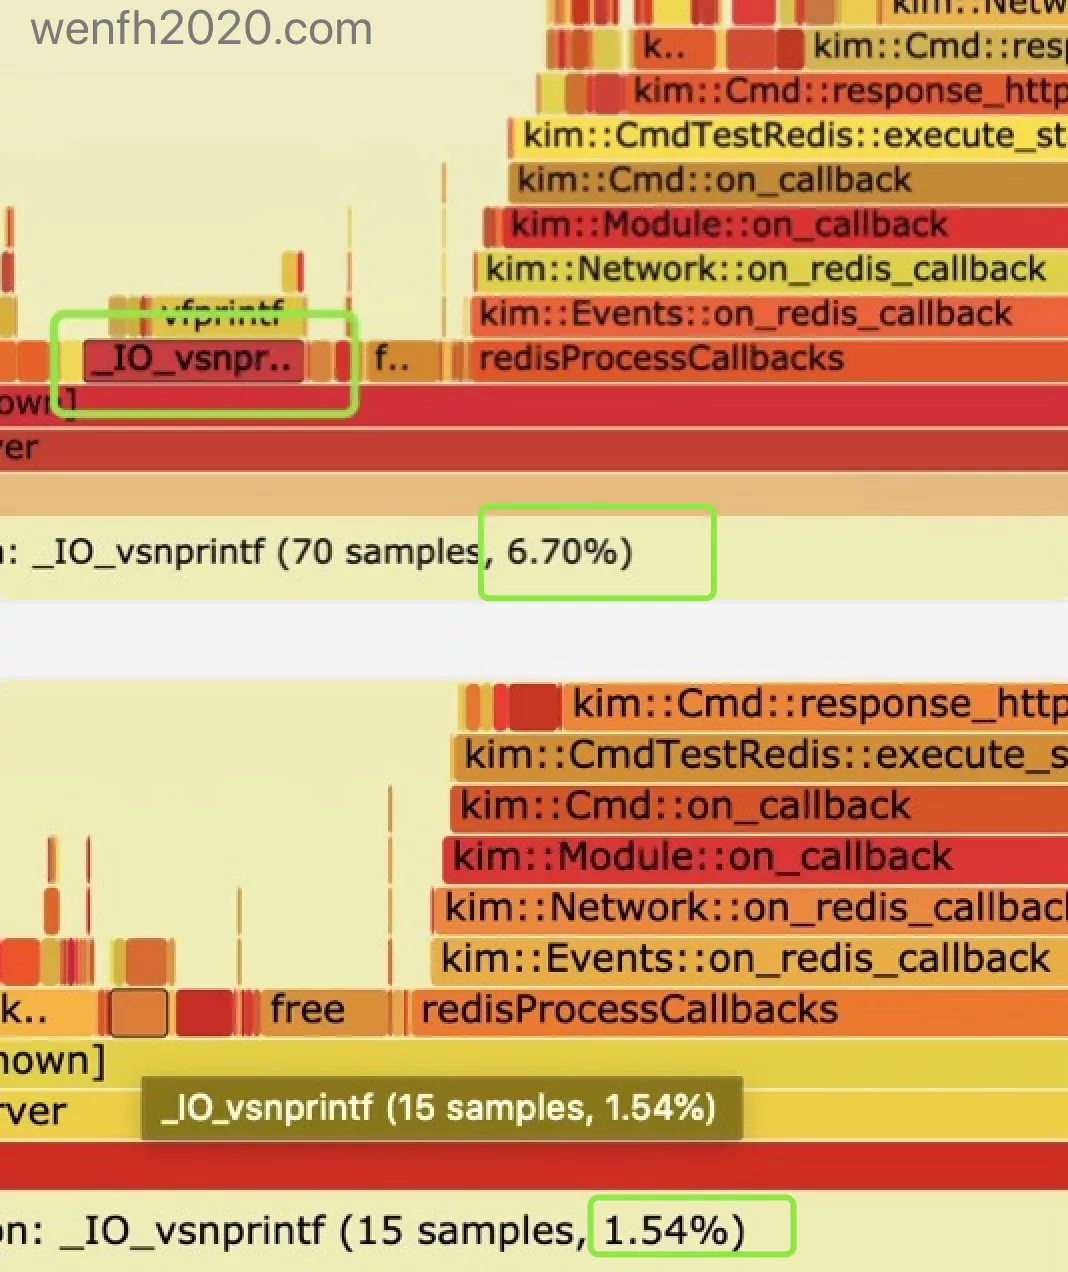
从上图可见,优化前 vsnprintf 函数的调用频率较高,占总采样时间的 6.7%。
经代码分析发现,日志级别判断被放置在 log_raw 函数内部,导致即使无需记录日志时仍会执行 vsnprintf 格式化操作。
将日志过滤逻辑提前至 vsnprintf 调用之前,优化后该函数的采样占比降至 1.54%,性能提升约 5 个百分点 —— good 😄!
1
2
3
4
5
6
7
8
9
10
11
12
13
14
/* 优化后的的代码。 */
bool Log::log_data(const char* file_name, int file_line, const char* func_name,
                   int level, const char* fmt, ...) {
    /* 根据日志等级,过滤不需要存盘的日志。 */
    if (level < LL_EMERG || level > LL_DEBUG || level > m_cur_level) {
        return false;
    }
    va_list ap;
    char msg[LOG_MAX_LEN] = {0};
    va_start(ap, fmt);
    vsnprintf(msg, sizeof(msg), fmt, ap);
    va_end(ap);
    return log_raw(file_name, file_line, func_name, level, msg);
}
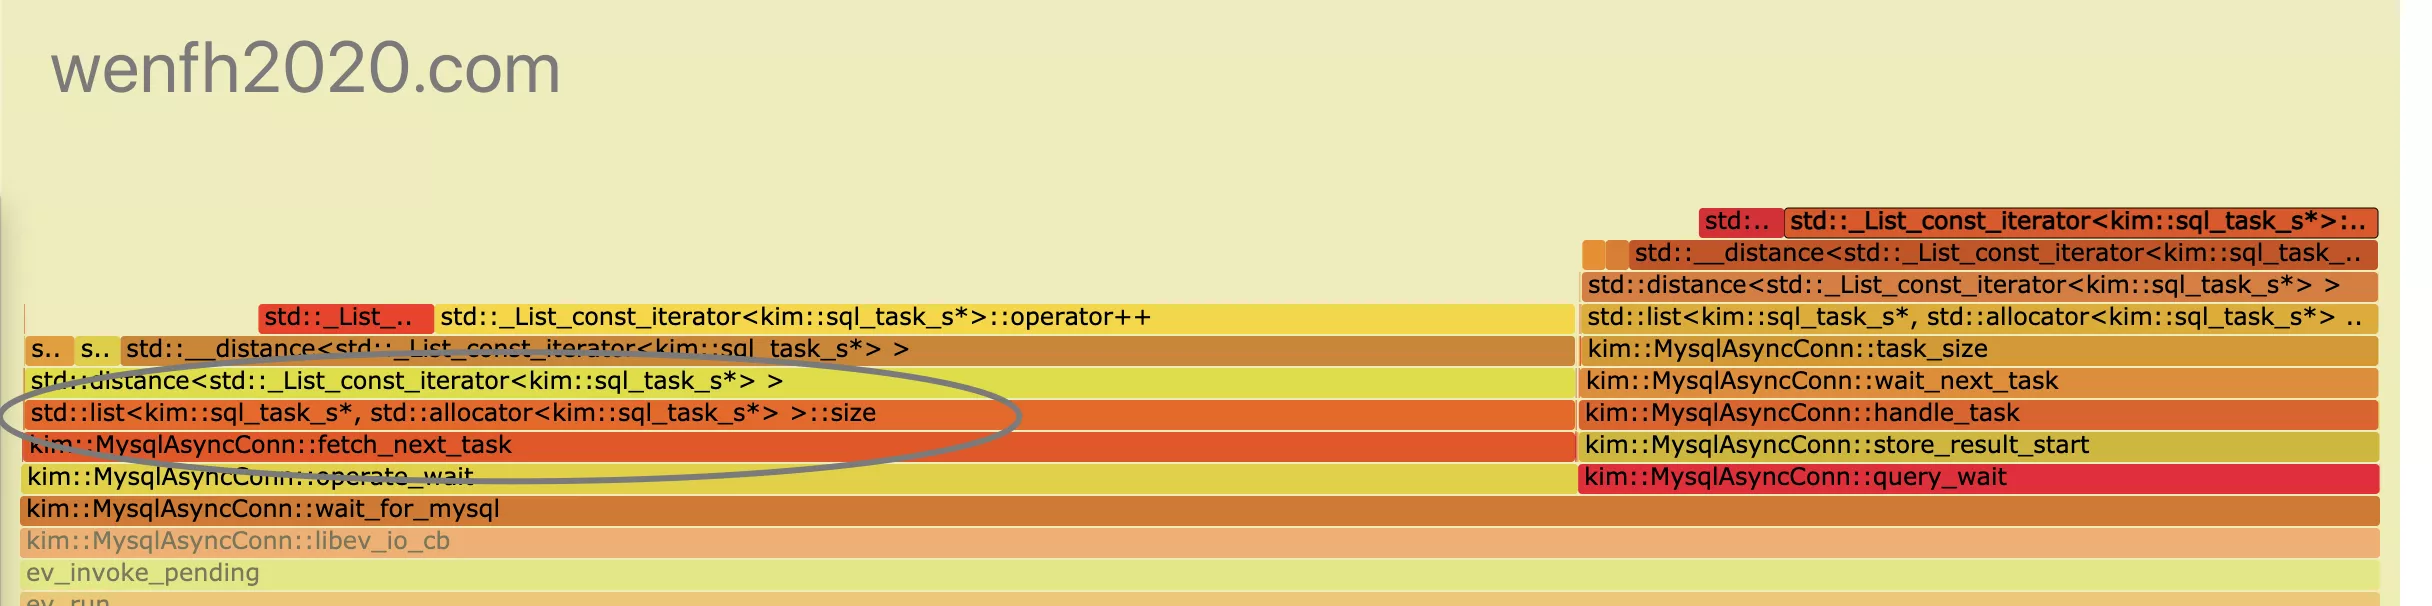
3.2.2. 案例二:std::list::size() 性能问题
如果不是火焰图,你无法想象 std::list::size() 这个接口的时间复杂度竟然是 O(N) 😱。
4. Off-CPU 火焰图
当进程或线程因阻塞操作(如 I/O、锁竞争等)导致性能下降时,Off-CPU 火焰图可用于分析其在非 CPU 执行状态下的时间消耗。其基本原理请参阅::Off-CPU Analysis。
- 慢操作示意图:
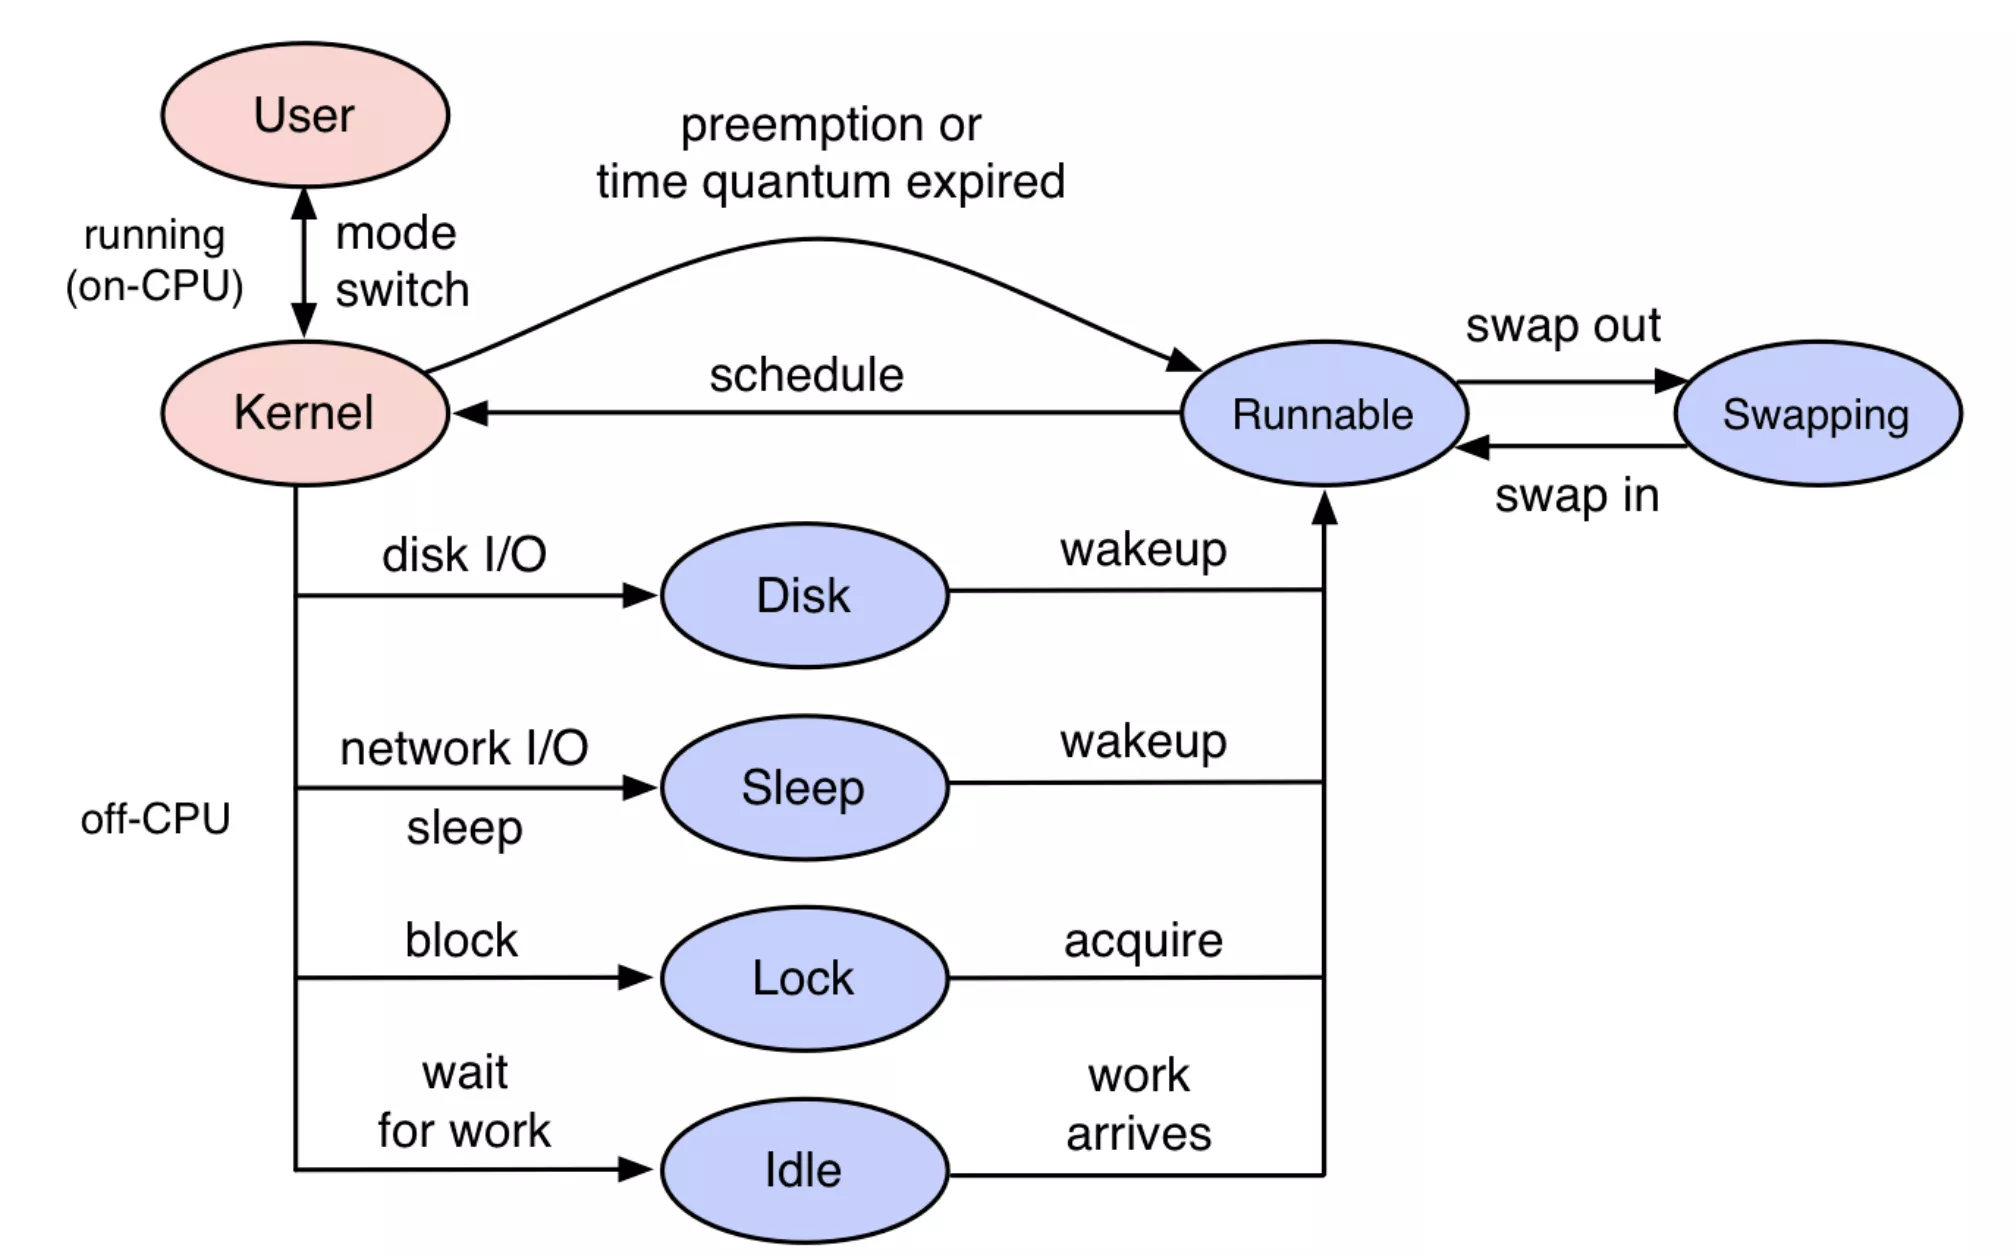
图片来源:Off-CPU Analysis
- 脚本 offcpu.sh,perf 数据采集和转化火焰图。
1
2
3
4
5
6
7
8
9
10
11
12
13
14
15
16
17
#!/bin/sh
work_path=$(dirname $0)
cd $work_path
if [ $# -lt 1 ]; then
echo 'pls input pid!'
exit 1
fi
# 采集了某个进程,10 秒数据。
perf record -e sched:sched_stat_sleep -e sched:sched_switch \
-e sched:sched_process_exit -a -g -o perf.data -p $1 -- sleep 10
perf script -i perf.data | stackcollapse-perf.pl | \
flamegraph.pl --countname=ms --colors=io \
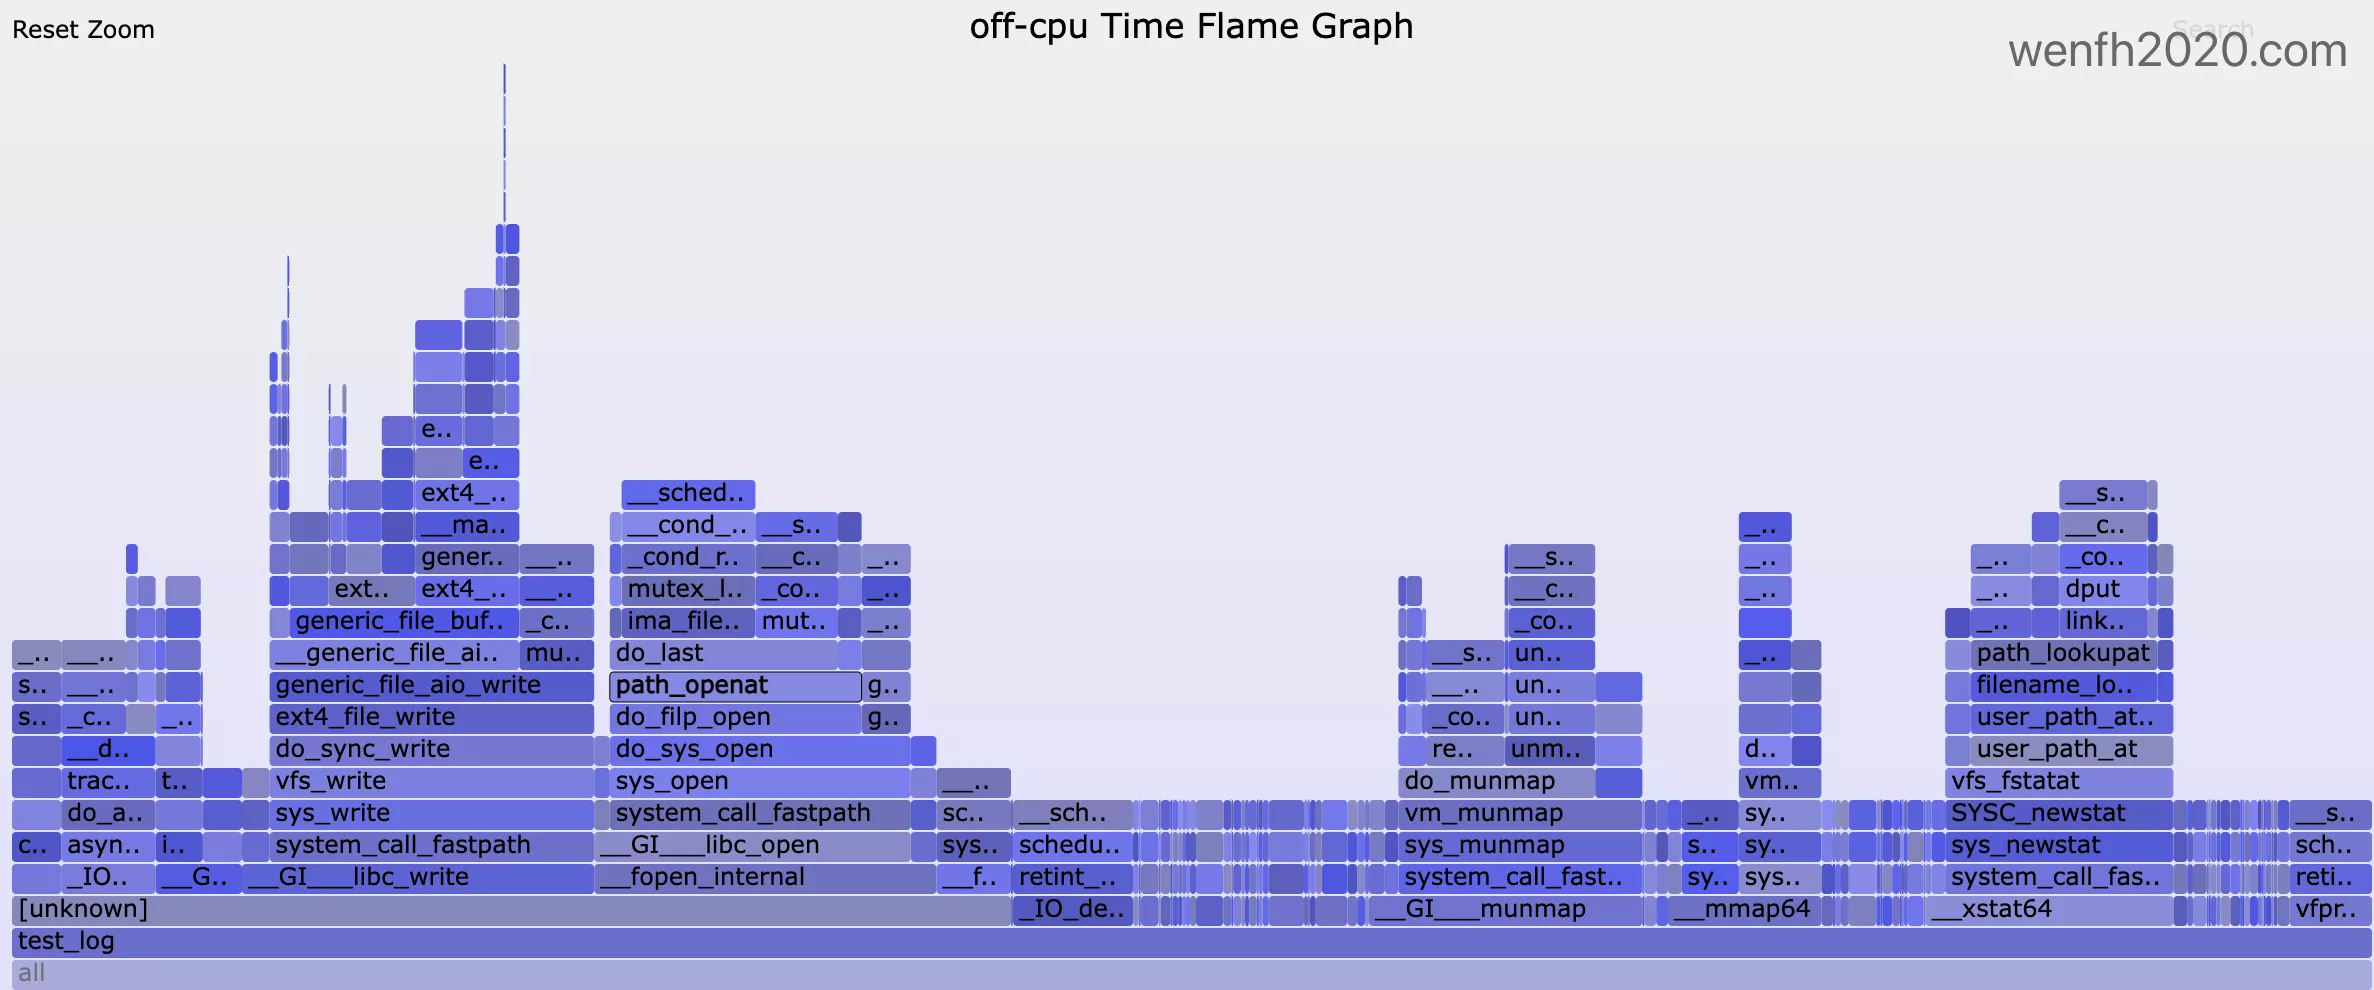
--title="off-cpu Time Flame Graph" > perf.svg
- 脚本使用。
1
./offcpu.sh <pid>
- Off-CPU 火焰图示例:下图展示了程序在写入日志至磁盘时的阻塞操作可视化结果: